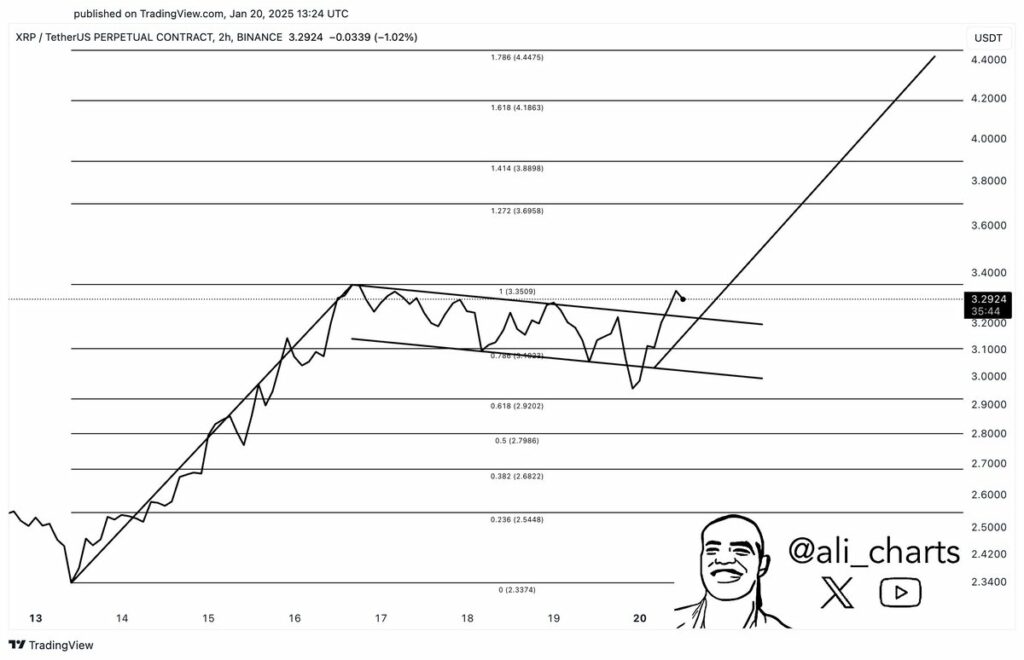
In a graph presented by crypto analyst Ali Martinez, XRP has exited a descending channel often referred to as a “bull flag,” indicating a likely continuation of its recent ascending momentum. This movement paves the way for a target of $4.40, according to Fibonacci extension levels.
XRP Price Targets $4.40
As noted in the two-hour Binance chart shared, XRP initially surged from approximately $2.3374 on January 13 to a local peak of $3.3509 by January 17, demonstrating a quick ascent that formed the so-called flagpole. Following this local peak at $3.3509, the price entered a consolidation period, fluctuating within a downward-sloping channel from January 17 to January 19 and briefly falling below the 0.786 Fibonacci retracement level at $3.1021 before rebounding.
The breakout above the channel’s upper limit, occurring around $3.20 on January 20, is regarded as a classic affirmation of a bull flag. A bull flag formation consists of two essential components: the rapid, nearly vertical rise (flagpole) and the following, less steep consolidation (flag). When the price of an asset closes decisively above the upper trendline of the flag, traders often interpret this as a cue that the preceding uptrend may resume.
Related Reading
In this particular scenario, the length of the flagpole is calculated from the swing low at $2.3374 to the swing high at $3.3509, resulting in a gain of about $1.01. Analysts then add that distance to the breakout level around $3.20 to estimate a price target in the $4.20 area.
However, Martinez’s chart also features Fibonacci extensions that outline more specific potential targets, based at 0% ($2.3374) and 1 ($3.3509). These extensions arise at 1.272 ($3.6958), 1.414 ($3.8889), 1.618 ($4.1863), and 1.786 ($4.4475). The analyst identifies $4.40 as the primary bullish target, aligning closely with the 1.786 extension level.
Related Reading
According to Martinez’s chart, XRP traded around $3.29, lingering just below the local peak at $3.3509. If the cryptocurrency manages to stay above the breakout area and ultimately exceeds $3.3509, the technicals on the chart indicate a potential rise toward successive extension levels in the higher $3 range and eventually to $4.40.
The relevance of the $4.40 target is attributed to the convergence of Fibonacci analysis with the conventional bull flag anticipated movement, providing traders with a clear upside point to monitor for sustained momentum. While short-term variability remains a possibility in volatile crypto markets, the breakout from the flag consolidation has emitted a notably bullish signal, contingent on XRP’s capability to uphold support near $3.20 and generate sufficient volume to surpass the $3.3509 level.
Significantly, XRP was unable to defend the breakout. At the time of writing, XRP had retraced back into the channel and was trading at $3.06. Therefore, XRP bulls need to rally once more to reaffirm the scenario.
Featured image generated with DALL.E, chart from TradingView.com

